
Arranging & Stacking Dimensions
A Workview reports against a cube, and every dimension on that cube has to sit somewhere. The Dimension Editor panel down the left of the Workview is where each one is placed, by dragging it between four positions.
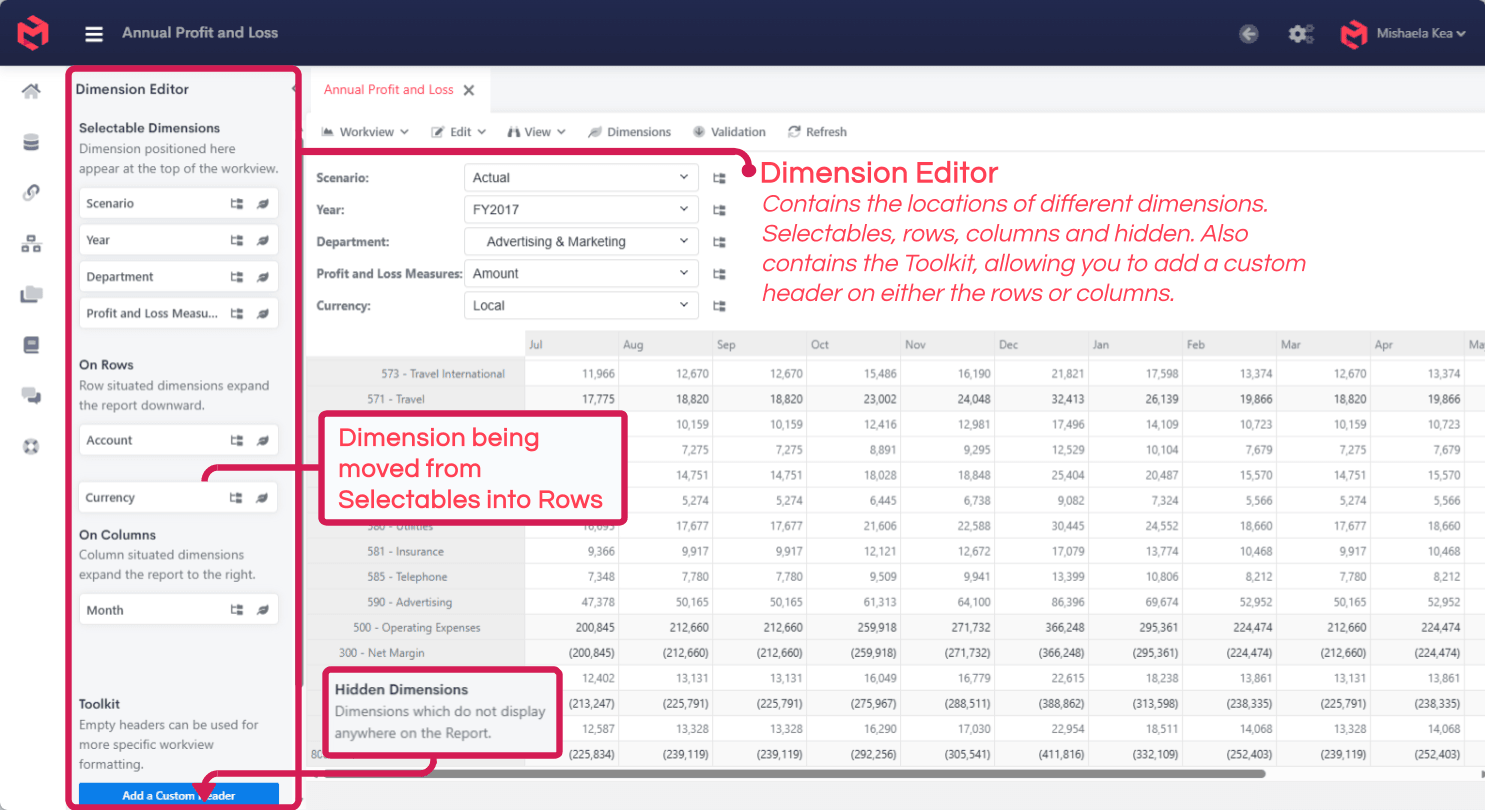
| Position | Effect |
|---|---|
| Selectable Dimensions | Appears at the top of the Workview as a dropdown, letting the reader pick one element at a time. |
| On Rows | Expands the report downward, one row per element. |
| On Columns | Expands the report to the right, one column per element. |
| Hidden Dimensions | Doesn't display anywhere on the report. |
Every dimension must be in one of the four - a cube's dimensions are not optional, only positioned. A dimension you have no interest in reporting on still has to be somewhere, which is what Hidden is for.
Why the arrangement matters
The same cube produces entirely different reports depending on where its dimensions sit. Nothing about the underlying data changes - only which axis each dimension is projected onto.
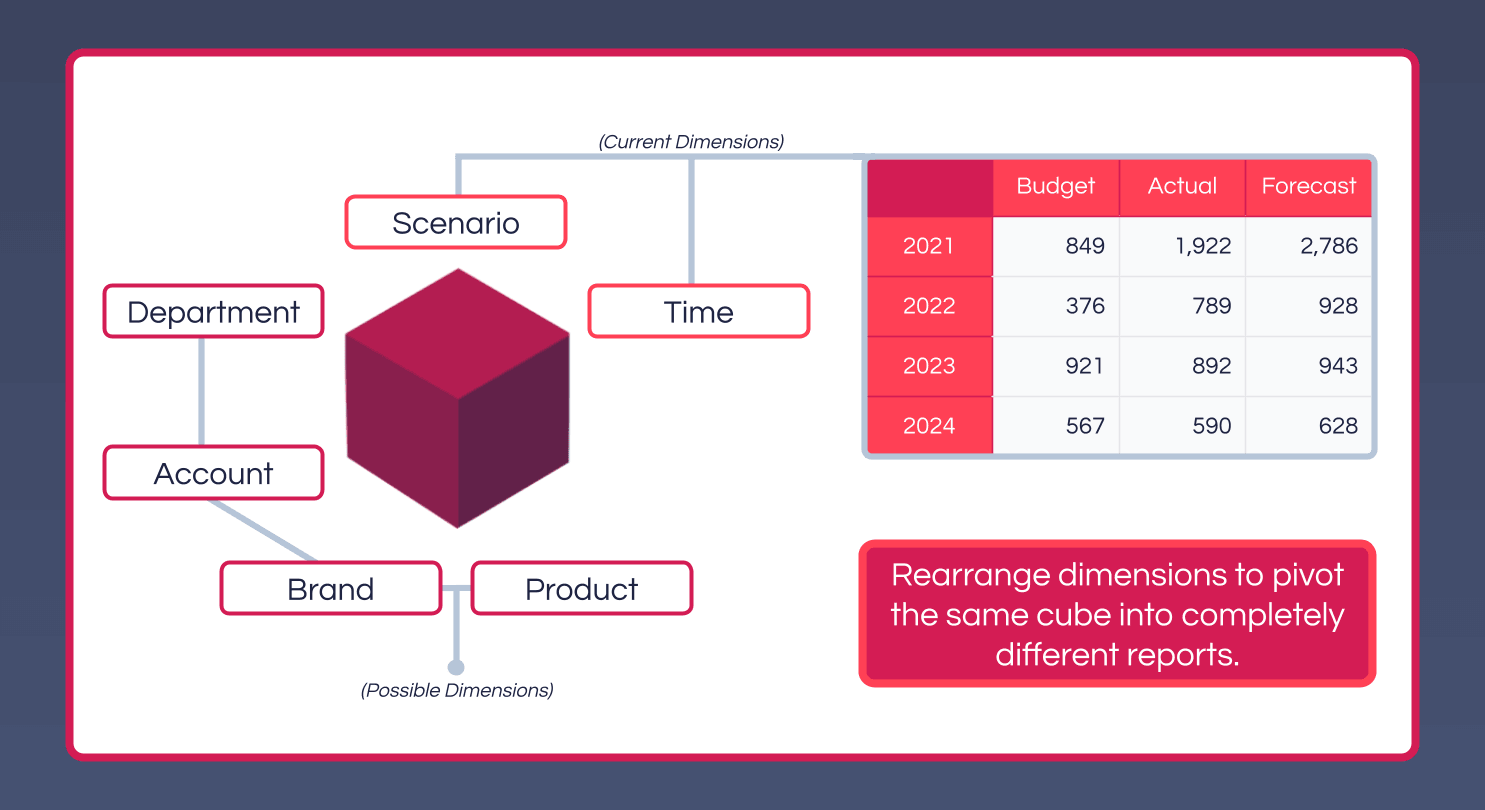
This is why a handful of well-built cubes can serve dozens of reports. A Profit and Loss cube with Account on rows and Month on columns is a monthly P&L; move Scenario onto columns and Month into the titles, and the same cube becomes a scenario comparison.
Stacking
More than one dimension can sit on the same axis. Stacking places them one above the other on columns, or side by side on rows, so the axis reads as a combination rather than a single list.
Stacked axes don't have to be symmetric. Because each set on an axis is built independently, a single report can carry several column groups that share no structure at all:
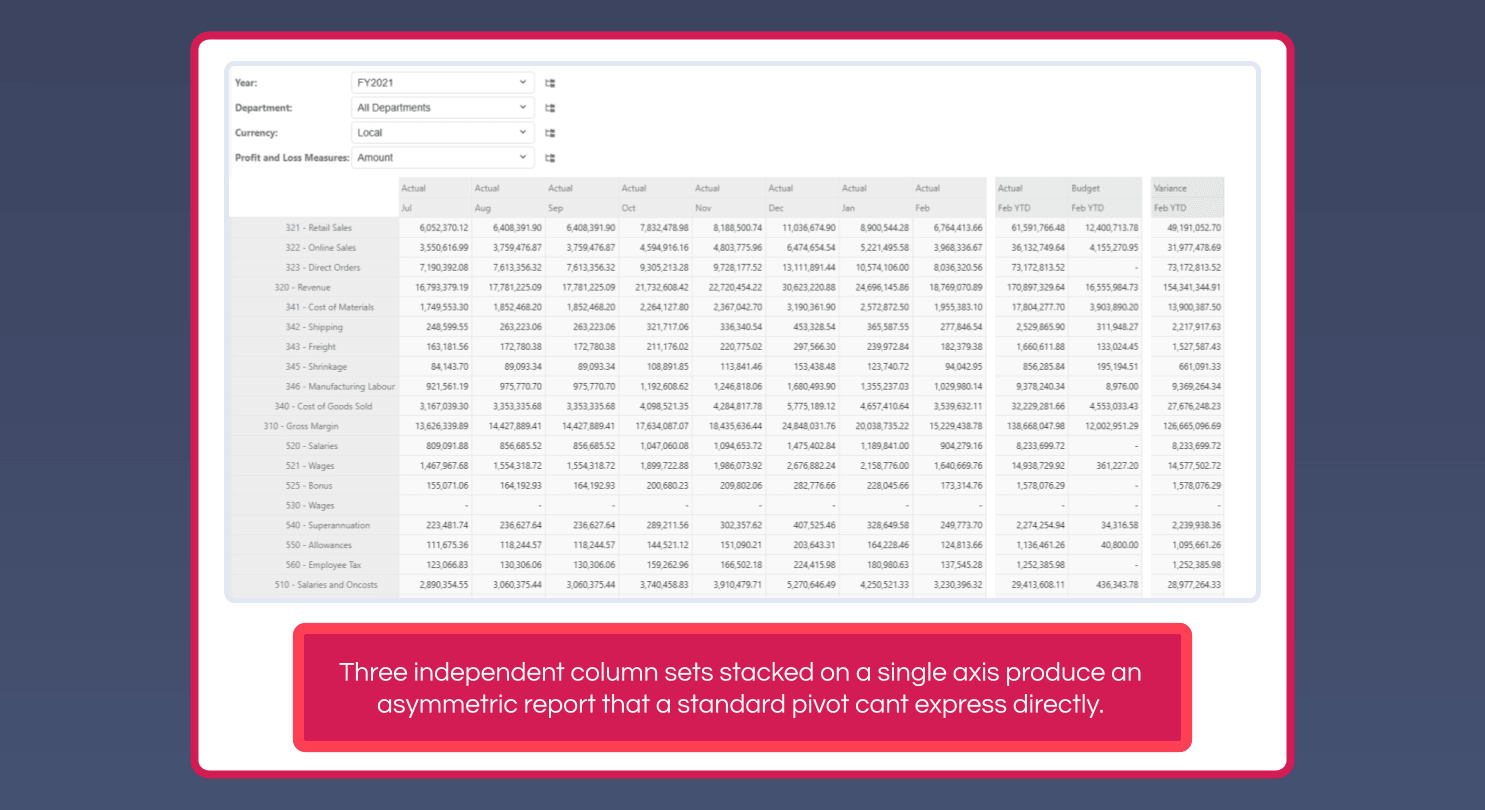
Three independent column sets stacked on a single axis produce an asymmetric report that a standard pivot can't express directly - months of actuals, then an Actual/Budget year-to-date pair, then a variance column, all on one row of headers.
This is a defining difference from spreadsheet pivot tables, which force every column group to share the same structure. See Set Instructions for how each set on an axis is built, and Simple Set Functions for the instruction basics.
The Toolkit
Below the four positions, the Toolkit adds a custom header to the rows or columns. Empty headers are used for more specific Workview formatting - a spacer column between two stacked sets, or a label row that isn't driven by a dimension at all.
Related
- Creating Workviews - building the Workview these dimensions sit in
- Set Instructions - controlling which elements appear on each axis
- Workview Sets and Set Editor - editing a single axis's set
- Using Cell and Heading Styles - formatting the result